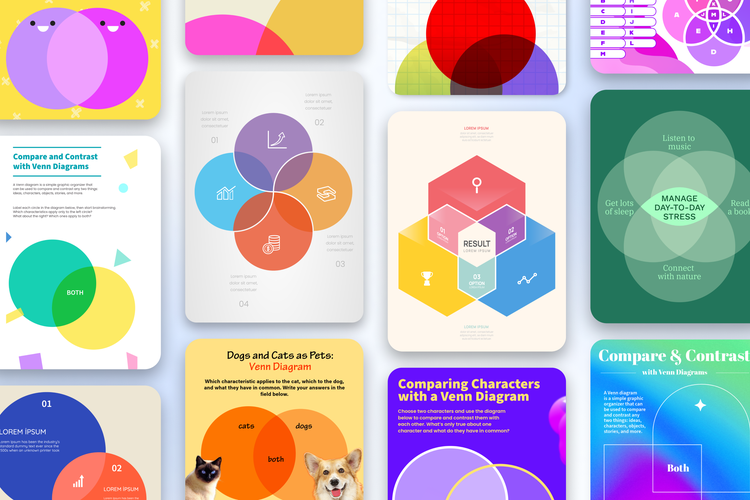
Using a Venn diagram in the classroom is a powerful way to help students visualize relationships between concepts. This classic graphic organizer allows learners to see where ideas overlap and where they differ, turning abstract data into a clear visual map. By incorporating these tools into your lesson plans, you can boost student engagement and improve information retention across any subject.
Key takeaways
- Venn diagrams help students compare and contrast ideas visually, making complex lessons easier to process.
- These tools support critical thinking, pattern recognition, and logical reasoning across all grade levels.
- You can apply these diagrams in diverse subjects, including math, science, social studies, and language arts.
- Using professional Venn diagram templates saves teachers time while providing students with high quality learning aids.
- Digital tools like a Venn diagram maker allow for easy customization and interactive classroom activities.
What is a Venn diagram?
A Venn diagram is a visual tool used to show the relationship between different sets of items. It was originally popularized by mathematician John Venn in the 1880s and has since become a staple in education and data analysis.
- This diagram typically consists of overlapping circles.
- The area where circles overlap represents common traits between groups.
- The areas that don’t overlap show the unique characteristics of each set.
- It’s often referred to as an overlapping circles chart or a logic diagram.
Why Venn diagrams are essential for teaching
Integrating a Venn diagram into your teaching strategy provides immediate benefits for both educators and students. For teachers, it’s a quick visual aid that clarifies a lesson in seconds.
- Teachers use them to communicate similarities and differences effectively.
- They provide a structured way to distinguish between multiple complex concepts.
- They act as a scaffold for students who struggle with text-heavy information.
- Students gain the ability to detect patterns and organize their thoughts logically.
- These diagrams help students develop project plans by categorizing necessary tasks and resources.
Benefits of data visualization in education
Data visualization is more than just a design choice; it’s a cognitive tool that enhances the learning process. Using a Venn diagram maker to create clear visuals can transform the classroom experience.
- Visualization enhances comprehension by making abstract ideas more concrete.
- Interactive and visually appealing materials capture student interest and encourage participation.
- Visual aids support long term memory retention by providing a mental image of the data.
- Diagrams help students process information faster than reading through long paragraphs of text.
Venn diagram teaching strategies by subject
If you’re looking for how to make a Venn diagram relevant to your specific curriculum, consider these subject-based applications.
- In math, use them to differentiate geometry concepts or show relationships between sets of numbers.
- In social sciences, they’re perfect for comparing different political ideologies, historical eras, or cultural identities.
- In humanities, students can diagram characters from literature or compare the themes of two different novels.
- In science, use them to compare biological processes like mitosis and meiosis or to differentiate between chemical elements.
How to create Venn diagrams that grab attention
A plain black and white diagram works, but a visually striking one keeps students focused. When you use a Venn diagram maker, follow these tips to ensure your materials stand out.
- Use high-contrast colors to distinguish between different circles.
- Incorporate icons and small images instead of just text to represent concepts.
- Adjust the transparency of the overlapping sections to highlight the shared traits.
- Choose clean and modern fonts that are easy to read from the back of the classroom.
- Utilize pre-designed Venn diagram templates to ensure professional spacing and alignment.
Other visualization tools for teachers
While the Venn diagram is a versatile favorite, other tools can complement your visual teaching strategy.
- Slideshows and presentations provide a dynamic way to deliver multimedia content.
- Digital portfolios allow students to track their progress and showcase their best work over time.
- Concept maps and mind maps help students brainstorm and see how small details connect to a larger theme.
Simplify your prep with Venn diagram templates
Creating classroom materials from scratch is time consuming. Using professional Venn diagram templates allows you to focus on teaching rather than formatting. Tools like Adobe Express offer a free Venn diagram maker that simplifies the design process for both teachers and students.
- Access a variety of templates for handouts, digital assignments, and classroom posters.
- Use simple drag and drop tools to resize circles and add text.
- Explore a library of educational icons and fonts to personalize your diagrams.
- Students can use these tools to create their own diagrams, promoting digital literacy.
- The templates are ready to use immediately, which is ideal for last minute lesson adjustments.
Ready to level up your teaching strategy? Try Adobe Express today for free.