ILLUSTRATOR FEATURES
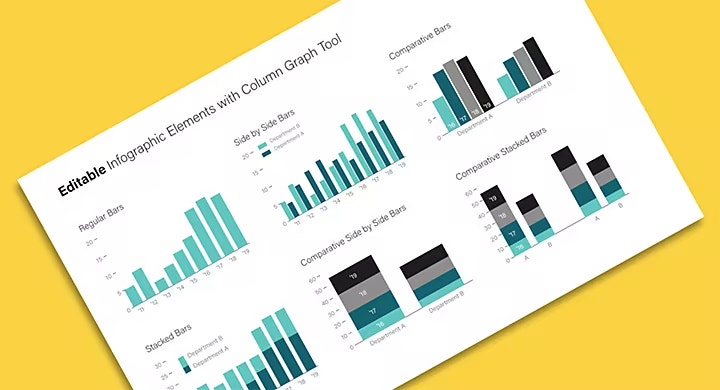
Design professional charts and graphs.
Inform your audience with clear data visualization. Import data with ease and create compelling pie charts, flowcharts, and more with Adobe Illustrator.

Take your graphs and charts to the next level.
Build professional charts and graphs for your presentations, marketing brochures, infographics, and much more. Illustrator helps you present data exactly how you want it and in a way that reflects your brand style.

Add clarity with icons.
Make graphs pop with color.
Design your labels for maximum effect.
Access Adobe Creative Cloud tools to help you customize any chart type.
Find icons and chart templates.
Kick-start your design by browsing an extensive library of existing icons and chart templates in Adobe Stock.
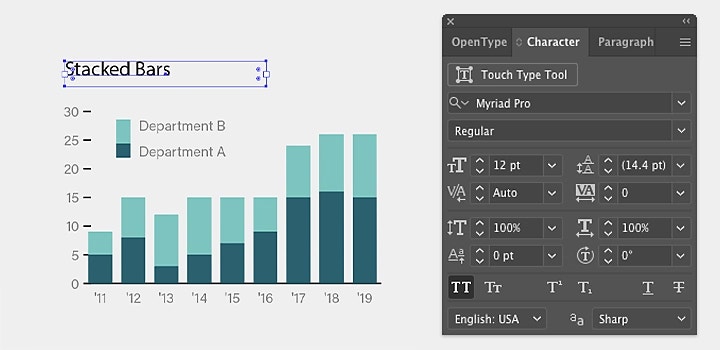
Select perfect fonts.
Capture the exact style you want to portray in your charts and graphs with more than 17,000 professionally designed typefaces in Adobe Fonts. Adjust any font to ensure your labels complement data rather than distract from it.
How to create a graph in Illustrator.
Design custom charts and graphs in a few simple steps.
- Identify it:
Identify your data source. Whether it’s in Google Sheets or Microsoft Excel, just export the info as a CSV file. - Select it:
Determine the type of graph you want to create. You can create any type of graph or chart in Illustrator to tell your story. - Graph it:
Select the Illustrator Graph tool to create a graph of any scale. Then upload the CSV file into the graph. - Refine it:
Customize how your data is visualized and represented. Change colors, typefaces, and typestyles; move, reflect, shear, rotate, or scale any or all parts of the graph. The ability to customize is limitless.
Start perfecting your chart-maker skills with these Illustrator tutorials.
Design engaging graphs from scratch.
Learn how to import your data and use drawing tools to create various styles of custom graphs.
Fine-tune your charts and graphs.
Explore the flexibility of chart software capabilities in Illustrator and learn to tweak and adjust every aspect of your graphs.
Add interest to graphs with pictures and symbols.
Update classic graphs with pictures and symbols to keep your audience and team members engaged in your data’s story.
Build your own icons.
Craft custom icons for your org charts, floor plans, radar charts, and more, turning simple shapes into unique presentation elements.
Discover a world of free chart templates.
Put a spotlight on your data with professionally designed chart and graph templates.