Guide to visual communication and actionable examples and templates

The secret to visual communication that works? Show, don’t tell.
Even if “a picture is worth a thousand words,” a bad infographic can still miss the mark. Modern media spends a lot of time catching your eye, but not so much holding your attention, and you might have noticed from the countless examples of visual communication that surround us that it can be difficult to balance high-quality design with accurate information and helpful data visualization.
This guide to visual communication will show you how to be clear, concise, and convincing when telling a story through imagery, data, and words. Whether you're a marketer, educator, or someone looking to better tell the story that data presents, then mastering the basics of visual communication is essential.
Here’s the why, the what, and the how — made easier-than-ever with Adobe Express.
Summary/Overview
Crafting a cohesive visual identity and choosing the right visual elements
The most effective examples of visual communication represent data, instructions, routines, or systems, while keeping text to a minimum. Widely used examples like infographics can be a fun visualization of a single data point supporting a larger story, or an entire page that uses distinct visuals to share multiple pieces of information about one core topic.
The core principles remain the same no matter your purpose:
- Clearly articulate your main message.
- Leverage the visuals as proof points to your thesis.
- Let your design do the rest of the work.
Before diving into design, consider the information you'll need to support your story. For instance, if you want to emphasize the growing influence of social media, gather statistics on the number of users, daily usage, and demographic data. With your data on hand and the theses and vision for your visual story sketched out, it’s time to consider how you want your infographic to look — decisions on imagery, color, and typography will all be crucial to your visual communication project.
Imagery
Visuals are the heart of effective communication. In Adobe Express, you can explore libraries of icons, design assets, and graphics to enhance your data presentation. Plus, you can easily upload and edit chart images, making it a breeze to incorporate them into your infographics.
Indicators are perfect for highlighting single-value data, allowing you to emphasize key statistics in your visuals. Pair them with fonts and colors that match your branding to create an effective tool for education.
Pictograms offer a creative way to represent parts of a whole. Rather than relying on traditional bar graphs, use relevant images or symbols to represent data points, adding a touch of personality to your visuals.
Color
Choosing the right color palette is crucial for successful visual communication. Color evokes emotions and sets the tone for your message, not to mention catching eyes and making a strong first impression.
Understanding the core four types of color combinations is essential for any designer. These combinations play a fundamental role in color theory and provide a starting point for your design journey.
But how do you choose the right colors? Color, and the emotions they evoke, help us to gain an understanding of what we’re feeling based on whatever we’re looking at. That is why choosing the correct color palette for your project is an essential step in making any design successful.
With Adobe Express, you can search for color palettes under the Colors tab using a keyword to find palettes that match your ideal theme. There are countless color possibilities to try when creating your visual communication project.
Typography
Pick a type — or two! Simplicity is key when it comes to text. Limit your use of different type families and ensure they are consistent with your branding. Using more than one typeface is acceptable, but make sure they offer visual contrast. Keep different sizes and styles to a minimum, ensuring a unified and accessible design.
For example, you might pair a serif font (a font with “tails,” like Times New Roman) with a sans serif font (a font without “tails,” like Arial), but not two serif fonts together. Also, limit the use of different sizes and styles to what is really necessary. Practicing restraint here will help your design feel more streamlined.
Beyond words: harnessing infographics and data visualization
Data visualization is a powerful tool for representing complex information with simplicity. It highlights trends, growth, and changes in data, making it easier for readers to connect with valuable insights.
Making use of fundamental tools like charts, indicators, and infographics, data visualization simplifies the stories told by today’s massive datasets, helping teams to identify connections and relationships between data, and enabling better business decisions and more meaningful strategy development.
Using infographics to simplify complex information and concepts
An infographic allows others to visualize your complex data story and get your point across. They typically feature a concise collection of smaller data visualizations, like charts and graphs, as well as eye-grabbing text, icons, imagery, and additional graphics. Together, they aid in presenting information in visually inviting ways that connect with readers. Infographics can be used across devices and platforms, including PDFs, printouts, social posts, and more.
The best infographic designs represent data, instructions, routines, or systems, while keeping text to a minimum. They can be a fun visualization of a single data point supporting a larger story, or an entire page that uses distinct visuals to share multiple pieces of information about one core topic. When sketching out yours, focus on:
- Developing a visual hierarchy to emphasize the most important points.
- Establishing the flow of information to guide the reader through the infographic.
- Utilizing icon sets to connect images relevant to your topic with the data you wish to convey.
Think about the story you’d like to tell, and what data you’d need to collect to support that story. For example, if you’re trying to show growth in a brand’s social media presence, look for statistics on audience and engagement growth to determine and convey a trend.
Showcasing data through graphs, charts, and visual narratives
Charts are a versatile tool for conveying data, whether you're presenting percentages, growth, or trends.
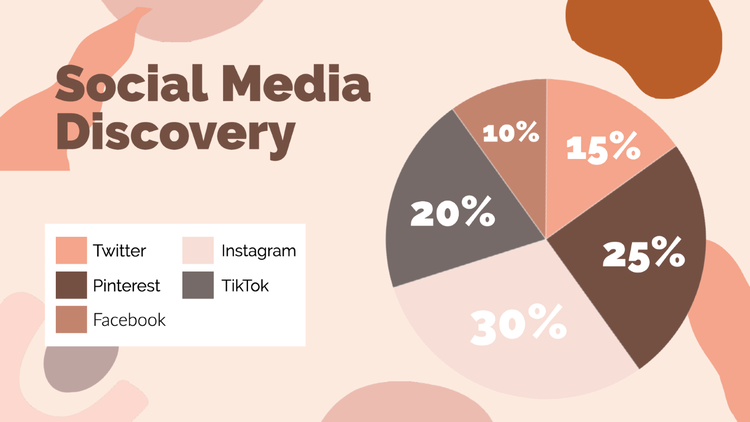
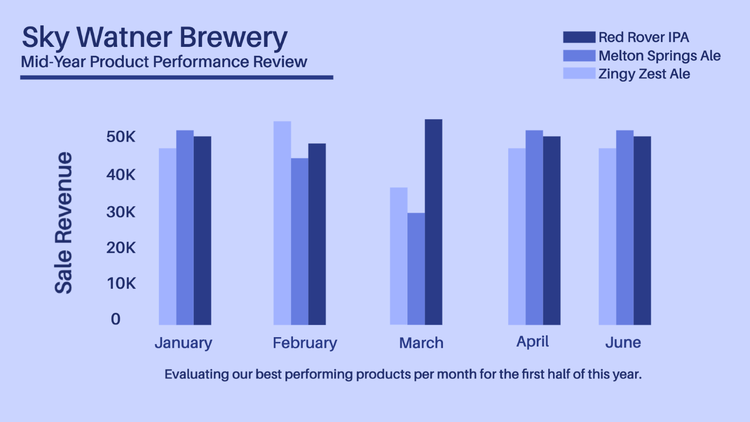
Pie charts, line charts, and bar charts can work together to create a comprehensive data visualization that helps convey your message effectively. They are a helpful way to represent analysis of data points like percentages, growth, or trends. Pie, line, and bar charts can work separately or together in an infographic to create a data visualization that creates understanding and consensus around research, metrics, ideas, and trends.
Case studies in visual excellence: examining successful visual communication
Good examples of infographics and other types of visual communication are all around us. The examples below feature visual storytelling that bring together the approaches and tools discussed above to create compelling and convincing arguments backed up by meaningful data and insight.
Deconstructing Less Plastic’s minimalist and iconic visual narrative
Because “[it’s] a frightening fact that every single piece of plastic ever made still exists somewhere on this planet,” the environmental organization Less Plastic created a concise and helpful visual guide to living with and utilizing less plastic. Their strong choice of fonts and a high image-to-text ratio of content gets their point across quickly, and most importantly, actionably.

Analyzing the Consortium for Wildlife Bycatch Reduction’s powerful visual storytelling
To illuminate the issues of destructive and wasteful industrial fishing practices, the Consortium for Wildlife Bycatch Reduction wasted no opportunities in citing highly contextual and jarring data on the consequences of “bycatch,” using nautical iconography and bold sans serif fonts to convey these consequences in numbers.

Savoring LinkedIn’s mouthwatering blog advice
When LinkedIn decided to create an infographic on the topic of content strategy, they pulled every ingredient out of the proverbial pantry and cooked up a masterpiece. Utilizing charts, food photography, vibrant colors, and strong typography, this infographic is a Michelin-starred example of visual communication.

Using Adobe Express to supercharge your visual communication and storytelling
It’s your visual communication, so make it unique — make it you. Adobe Express allows you to make changes to every aspect of your design, from text styles to background color. It’s easy to create visual communication projects that stand out. Play around with the various tools until you’re happy with what you see in the preview panel.
Do you need some inspiration to get started on your infographic? Enjoy access to thousands of free templates, licensed Adobe Fonts, royalty-free Adobe Stock images, and graphic design elements that you can add right to your visual communication design. You can also easily upload photos, logos, or fonts right from your own device to your design.


