Illustrator features
Create compelling infographic designs.
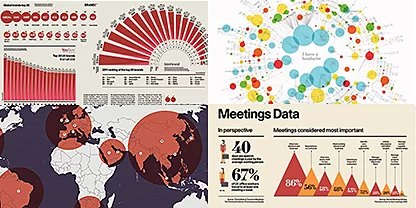
Go beyond basic pie charts with Adobe Illustrator. Captivate readers with effective infographic design that uses data points and visual content to tell your story at a glance.
Free trial|Free trial Illustrator Buy now|Buy now Illustrator

Take data visualization to the next level.
Get the tools you need to build design elements for beautiful infographics that blend narrative copywriting with complex data and creative design.

Stylize your art, charts, and graphs.
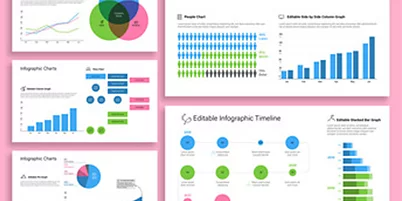
Design eye-catching bar graphs, flowcharts, timeline infographics, and more with the Charts tool. Clearly label elements for easy comprehension.
Keep data up to date.
Adjust information and data points without redoing artwork with the Charts tool. Use Data Merge to create multiple versions of your infographic design.

Design icons that pop.
Present content in a unique way. Create custom icons that enhance infographics by adding clarity to your presentation.
Illustrate your point.
Bring a personal touch to your infographic style with Pen, Pencil, and Shape Builder tools that allow you to design impactful pieces.

Access versatile tools for infographic creators.
Ignite your creative vision with stunning typography and infographic templates. Use these files as a foundation for your work or bring them into Illustrator to amplify your design.

Find the right font.
Preview over 17,000 fonts to find styles that keep your information organized and interesting — compelling text helps make a good infographic great.

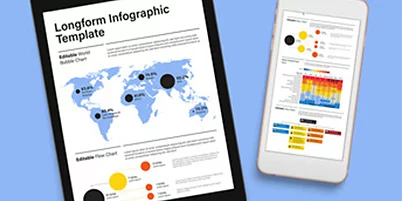
Get a head start.
Explore templates in a variety of styles and color palettes. A strong start can help you kick off your own infographics.
Hone your vector design skills.
With so many elements in each piece, designing infographics requires dexterity. Improve your abilities across Illustrator with these helpful tutorials.
Follow the infographic roadmap.
Explore what the best infographics have in common and learn the process behind their creation with this comprehensive blog post.

Create something iconic.
Discover how to create a set of vector icons that illustrate different features while unifying your infographic.

Raise the bar.
Add style and personality to simple bar graphs by replacing rectangles with unique, compelling shapes.

Draw the eye.
Design infographics that stand out by mastering the tools you need to create any vector art you can imagine.
Create eye drawing vector art|Create eye drawing vector art Illustrator
Dive into free infographic templates.
Illustrate your data and information with clear, crisp infographic designs.