How to create an infographic: A practical guide to designing infographics for projects and presentations.
Learn how to combine layout, text, and visuals to turn information into a clear, engaging infographic.


Learn how to combine layout, text, and visuals to turn information into a clear, engaging infographic.
An infographic is a visual representation of information that helps explain ideas clearly and quickly. It combines text, data and design elements to make complex information easier to understand at a glance.
In learning contexts, infographics help organise information so it is easier to understand and remember.
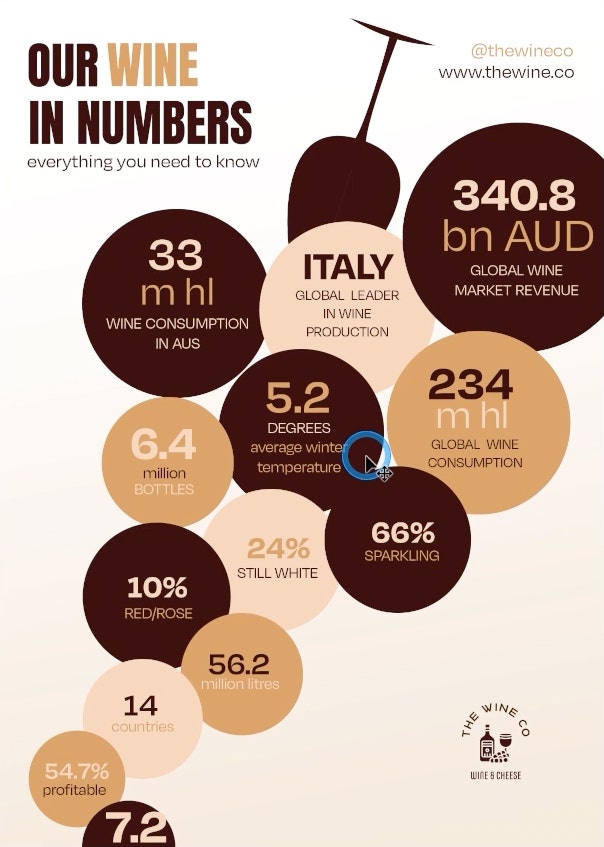
Infographics can be used in different ways depending on the kind of information you want to present and the purpose of your assignment or project.
Adobe Photoshop provides flexible design features that help turn information into clear, visually engaging infographics suitable for learning, presentations and projects.
If you’re just getting started, learning how to use Photoshop can help you take full advantage of these infographic design features.
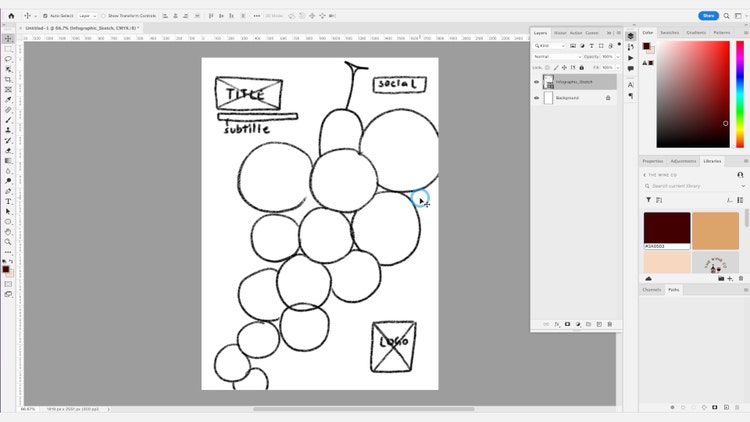
The sketch of an infographic provides a basic layout structure for your design. It helps you organise information visually before adding detailed content. Think about the visual language of your design and brand and use it as a key reference to shape your infographic. It is also important to map out the goal of your infographic, such as explaining a concept, comparing information or presenting data clearly.
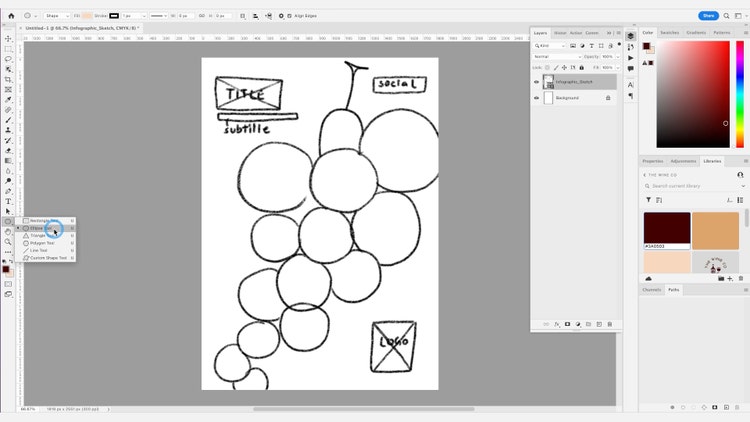
Your infographic can be identified not only by its data, but also by its design. Visual elements like shapes help guide the viewer’s attention to key information and structure the layout.
• To add a shape or design to your infographic, click and hold on the Shape tool in the toolbar to show the various shape options, such as Rectangle, Ellipse, Triangle or Customised Shape. Select the tool for the shape you would like to include in your design.
• To duplicate a shape, hold Alt on a PC or Option on a Mac and drag the shape into place. Experiment with spacing, alignment and repetition until your sketch clearly reflects the information you want to communicate.
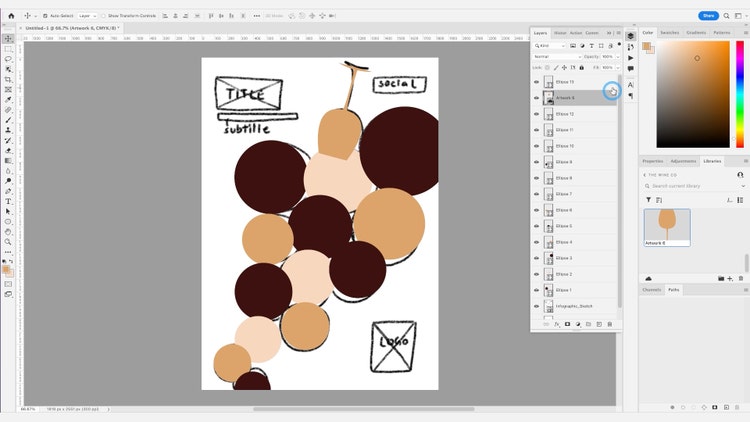
When you’ve created an outline of your infographic design, it’s important to include relevant visual assets that support your topic or message. If you have created branded assets like a company logo previously in Adobe Photoshop or in Adobe Illustrator, you can find these saved in your Creative Cloud Library and can insert them into your infographic to keep the design consistent and maintain brand awareness.
Using assets from Creative Cloud Library helps you reuse images, colours and graphics across projects, making your infographic easier to manage and update.
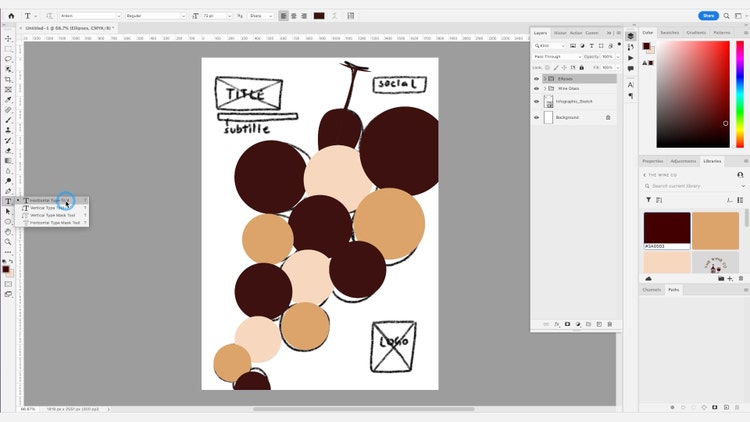
If you have designed other marketing collateral already, such as a promotional flyer or product mockup, you may already have identified and used a certain font family. Using the same font helps maintain consistency and improves readability across your infographic.
To add type objects and text, go to the horizontal Type Tool and click the canvas where you want to enter the text. Double click the pre-filled text and enter the text you want to add. To add more text layers, select the existing text, hold Option if you’re on a Mac or Alt key on a PC and drag down below to create a duplicate.
Font size and style play an important role in how easily information can be read. It is important that the font style you choose does not go below 9pt to ensure legibility for print. Selecting a simple font will ensure your infographic is easy to read.
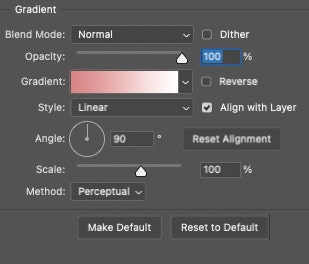
To finalise your infographic with a professional-looking finish, make small visual adjustments that improve depth and balance, such as adding a subtle gradient. To do so, add a new adjustment layer from the Layers panel and then click the gradient layer.
You can edit the gradient colours and style from Linear to Radial, Diamond etc. and even change the angle and direction of the gradient. A simple linear gradient often works best, as it adds visual interest without distracting from the information.
Once your design is complete, the final step is to export your infographic in a format suited to how it will be shared or submitted.
Exporting for screen use.
To export your graphic for screens, go to File > Export > Quick Export as PNG and browse to where you want to save the file. This format works well for digital sharing, presentations and online submissions.
Exporting for print.
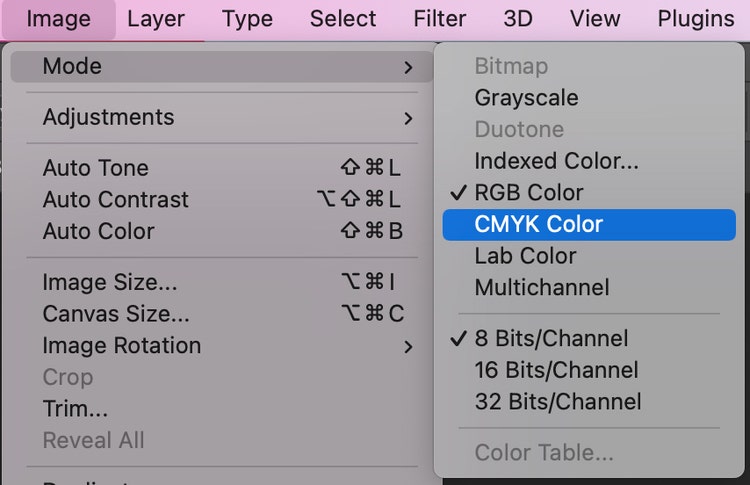
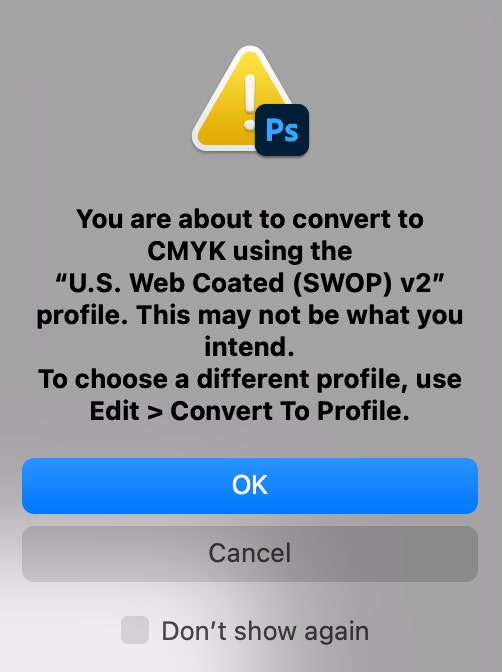
To export for print, firstly ensure to change the colour mode of the document to CMYK, go to Image > Mode > Select CMYK Colour. Dialogue boxes will pop up to indicate that some appearances may change when doing so. Make sure to group everything before and convert it to a smart object to ensure settings are preserved.
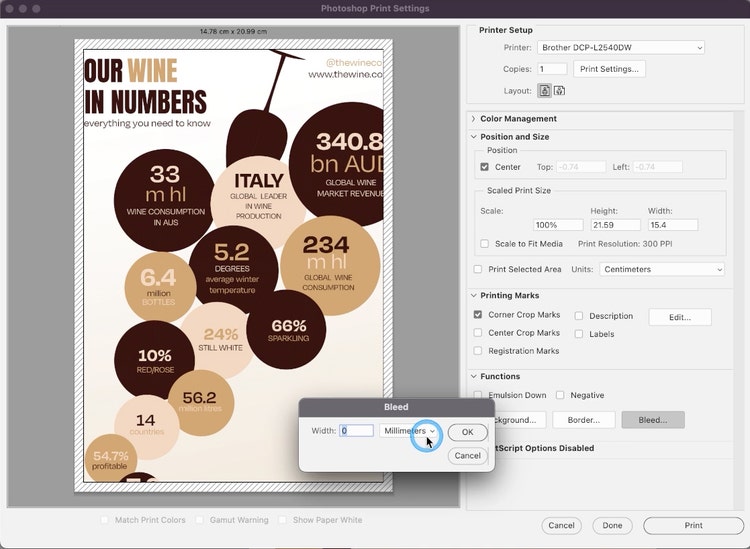
Once selected, go to File > Print > and set the settings for corner crop marks and set Bleed to 3 mm. Click Print or Save as PDF for future use. After exporting, review your file to ensure text, colours and spacing appear as intended.
Learn how to export files in Photoshop
You are now ready to create infographics for projects, presentations or personal use. With Adobe Photoshop, you can combine text, images and colour to present information clearly and creatively.
With Adobe Photoshop, the options of what you can create for your business or brand are endless. Seamlessly create marketing collateral in a flash or discover how to create a promotional flyer to add to your brand’s repertoire.
Get 20+ apps to create anything you can imagine, from simple social posts to standout portfolios. ₹398.99/moincl. GST for the annual billed monthly plan for the first year. See terms.

Based on your location, we think you may prefer the United States website, where you'll get regional content, offerings, and pricing.


