


Design
How to make an infographic when you're not a designer

Adobe Express
11/05/2026
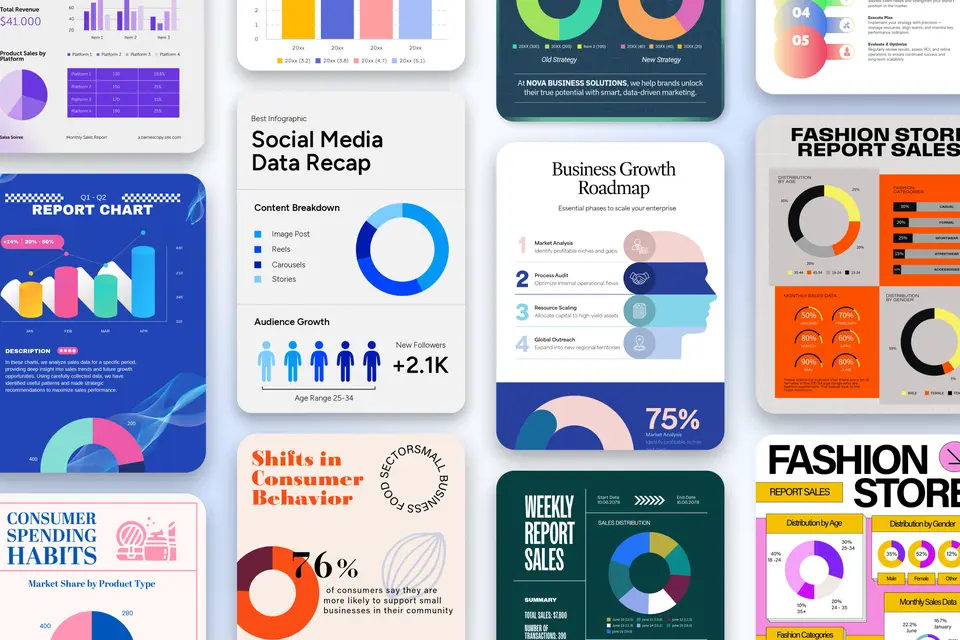
To make an infographic without design training, choose the chart or diagram that answers your reader’s question before choosing the template. Then build the layout around that visual, add readable labels and sources, and adapt it for its destination. A polished template can't rescue a chart that explains the wrong thing.
Key takeaways
- The Web Content Accessibility Guidelines (WCAG 2.1) say the contrast between text and its background should be at least 4.5:1 for regular text and 3:1 for large text.
- Bar lengths need a zero baseline for proportional comparisons. The Office for National Statistics’ bar-chart guidance explains this rule.
- Preserve an untouched copy of your dataset before editing, as Cornell Data Services recommends in its file-management guidance. Save source links separately.
What makes data visualization storytelling work?
Data visualization storytelling works when the chart answers the audience’s question. Imagine a school club explaining how attendance changed during a term. A line chart follows the sequence of meetings; a pie chart turns those same counts into shares of a combined total. Both can contain accurate numbers, but only the first answers the question about change. Styling can't repair that mismatch.
For a small business report or classroom handout, treat the chart choice as the first editorial decision, not the last decorative one. This walkthrough focuses on making a shareable graphic once you have a question worth answering. The broader guide to data visualization covers planning and purpose.
Use these recommendations as starting points, then check them against your content and audience.
Which infographic templates and chart types should you use?
Choose the chart or diagram that fits the relationship you need to explain, then select a template to support it visual. The chart-types guide explains the differences between numerical formats. Not every infographic needs numbers: a process can use a flowchart, and a system can use a labeled diagram. Don’t introduce a graph simply because the template has space for one.
| What you're showing | The chart that fits | How it can go wrong |
|---|---|---|
| A numerical trend over time | Line chart with time in order | Missing periods disappear, making an irregular sequence look continuous. |
| A ranking across categories | Horizontal bar chart | Alphabetical ordering hides the ranking; a truncated baseline distorts differences. |
| Parts of a complete whole | Stacked bar or simple pie chart | Overlapping categories imply a total that doesn’t exist. |
| Before-and-after values | Paired bars on the same scale | Different scales exaggerate or hide the change. |
| Steps or decisions in a process | Flowchart | Arrows imply an order that the actual process doesn’t follow. |
| Parts of a physical or conceptual system | Labeled diagram | Decorative detail crowds out the labels needed to understand it. |
| Overlapping groups | Venn diagram | Circles overlap even though the categories have nothing in common. |
| Roles and reporting relationships | Org chart | Connector lines don’t distinguish reporting relationships from collaboration. |
| One important number | Number card with a clear label and context | The number loses its unit, timeframe, or explanation of what it counts. |
For relationships rather than measurements, browse Venn diagram examples to see how shared membership works. The organizational chart examples address a different problem: Who reports to whom. Use those distinctions when browsing templates. A layout with attractive circles or connected boxes is useful only when its connections mean what your information says they mean. Otherwise, choose another structure before spending time on fonts and icons.
How do you turn complex data into a chart people understand?
To turn complex data into an understandable chart, isolate one question, prepare the relevant values, and check the visual before styling it. For the school-club example, keep the meeting dates and attendance counts together rather than combining attendance, fundraising, and membership into one graphic. The sequence below separates decisions about the evidence from decisions about presentation, so you can revise one without accidentally changing the other.
- Choose the question. Decide whether the reader needs to understand a trend, ranking, relationship, or process. For the club, “How did attendance change during the term?” is specific enough to guide the next decision.
- Prepare the relevant data. Keep the necessary labels, values, and units together. Check dates and missing entries. If a meeting’s attendance wasn’t recorded, don’t turn that missing value into zero attendance.
- Sketch the visual. Draw a rough version of the chart or diagram before searching for templates. Check whether the labels and relationships make sense. A plain sketch exposes problems that decorative elements might conceal.
- Write a supported headline. “Attendance rose during the term” describes a trend. “Our new meeting format increased attendance” claims a cause. Use the second only when evidence beyond the chart supports that explanation.
- Build an editable first draft. In Adobe Express, add a chart to your design through Charts and grids, then select Charts. Enter the labels and values rather than drawing bars by eye; the tool supports bar, line, pie, and progress charts.
- Review the graphic without narrating it. Show the draft to someone unfamiliar with the data. Ask them to share what they think it shows and let them help you discover the gaps. Revise the labels, headline, or chart before adding decoration.
Keep the source note with the graphic, not just in the document that originally contained the numbers. Include the dataset or report name, the relevant period, and any limitation needed to interpret it. A class survey shouldn’t look like a population-wide finding. When the infographic leaves your presentation or someone shares it without the surrounding paragraph, those details must travel with the visual.
Layout rules that survive a feed
A good layout gives readers a clear starting point and keeps related information together. The guide to visual communication explains hierarchy and structure; use the following rules to apply those principles to the actual graphic.
Make the headline and visual work together. Put the main point where a reader will encounter it and before the supporting details. A descriptive headline identifies the subject; a specific headline explains what the visual shows. Keep the chart close by so readers can check the claim without searching the page. If an illustration competes with the evidence, reduce its prominence rather than making everything equally large.
Give color a consistent meaning. Use the same color for the same category throughout the graphic, and pair it with labels or another distinguishing cue. World Wide Web Consortium guidance on using color says color shouldn’t be the only way to communicate information. In practice, “the darker line” isn’t a sufficient label. Name the series directly so readers can identify it without relying on color differences alone.
Check contrast at the final size. World Wide Web Consortium explanation of minimum text contrast accompanies the ratios above. Its large-text definition uses at least 18-point regular text or 14-point bold text, not whatever looks large in your editor. When an infographic shrinks, reassess the lettering as readers will see it. Keep source notes and labels readable, too; they explain the evidence, rather than merely decorating the bottom edge.
Put labels next to what they explain. Place a value near its bar and a process label near its step. Leave space between unrelated groups and keep alignment consistent within each group. Before adding another icon, ask what information it carries. A decorative symbol can disappear; a label can't. Test the exported image on a phone, where small spacing problems become more apparent than on a large editing canvas.
Which data visualization tools should you use?
Choose a template-led editor for the finished infographic, a spreadsheet for preparing values, and analytical tools when the data still needs investigation. A connected report serves a different purpose from a fixed graphic for a presentation, handout, or social post. The distinctions below are recommendations for choosing a workflow, not claims that a tool cannot perform any task outside its main use.
| Tool or capability | What it's for | When it's the wrong choice |
|---|---|---|
| Adobe Express infographic make | Editable infographic templates that provide an existing arrangement for text, visuals, and branding. | You still need to explore a complex dataset or build a connected analytics dashboard. |
| A spreadsheet | Organizing labels, values, dates, and units before creating the visual. | The main task is composing the finished infographic rather than preparing its data. |
| Chart-focused tools | Producing a chart, map, or table when the data display is the main deliverable. | The main task is arranging a poster-like composition with extensive illustration. |
| Interactive visualization tools | Presenting data that readers can explore through filters, additional detail, or changing views. | You only need a simple static graphic and wouldn’t use the interactive features. |
| Business analytics tools | Connecting, analyzing, and sharing business data through reports and dashboards. | You're starting from scratch solely to produce one shareable infographic. |
| Connected reporting tools | Keeping reports tied to live or regularly updated data sources. | Your deliverable is a fixed campaign graphic rather than a report people explore. |
A chart-focused workflow is a stronger starting point when the chart itself is the deliverable. An interactive visualization earns the additional setup when interaction lets readers ask useful follow-up questions. A template-led editor suits a finished message that needs a headline, supporting visuals, and brand styling around it. You can also combine tools: settle the analysis first, then bring the resulting chart into the layout without changing its values or labels.
Exporting for where it will be seen
Build one editable original, then adapt the composition for each destination. Adobe Express’s Resize page feature, available on Premium plans, offers presets and custom dimensions. Duplicate & Resize keeps the original while creating another version. Afterward, check the labels, line breaks, and source note rather than assuming the new canvas preserved the reading order. A tall handout may need several separate social graphics instead of one compressed image.


